
If you're trying to figure out what's normal in insurance agent recruiting, the conversations are full of opinions and short on actual numbers.
I've spent more than 20 years recruiting licensed insurance agents, building an IMO, and running recruiting campaigns across Medicare, final expense, life insurance, annuity, and P&C. Along the way I've pulled together the data points that actually matter when you're deciding how to recruit, what to budget, and what to expect.
This page compiles the most current, sourced statistics on insurance agent turnover, recruiting costs, cold email performance, and industry workforce trends, pulled from sources like SHRM, LIMRA, the Bureau of Labor Statistics, and industry research firms. I'll update it periodically as newer data becomes available.
Table of Contents
Insurance Agent Turnover Statistics
Turnover is the single biggest hidden cost in insurance agency recruiting, and the data shows just how severe it is compared to most other industries.
| Statistic | Figure | Source |
|---|---|---|
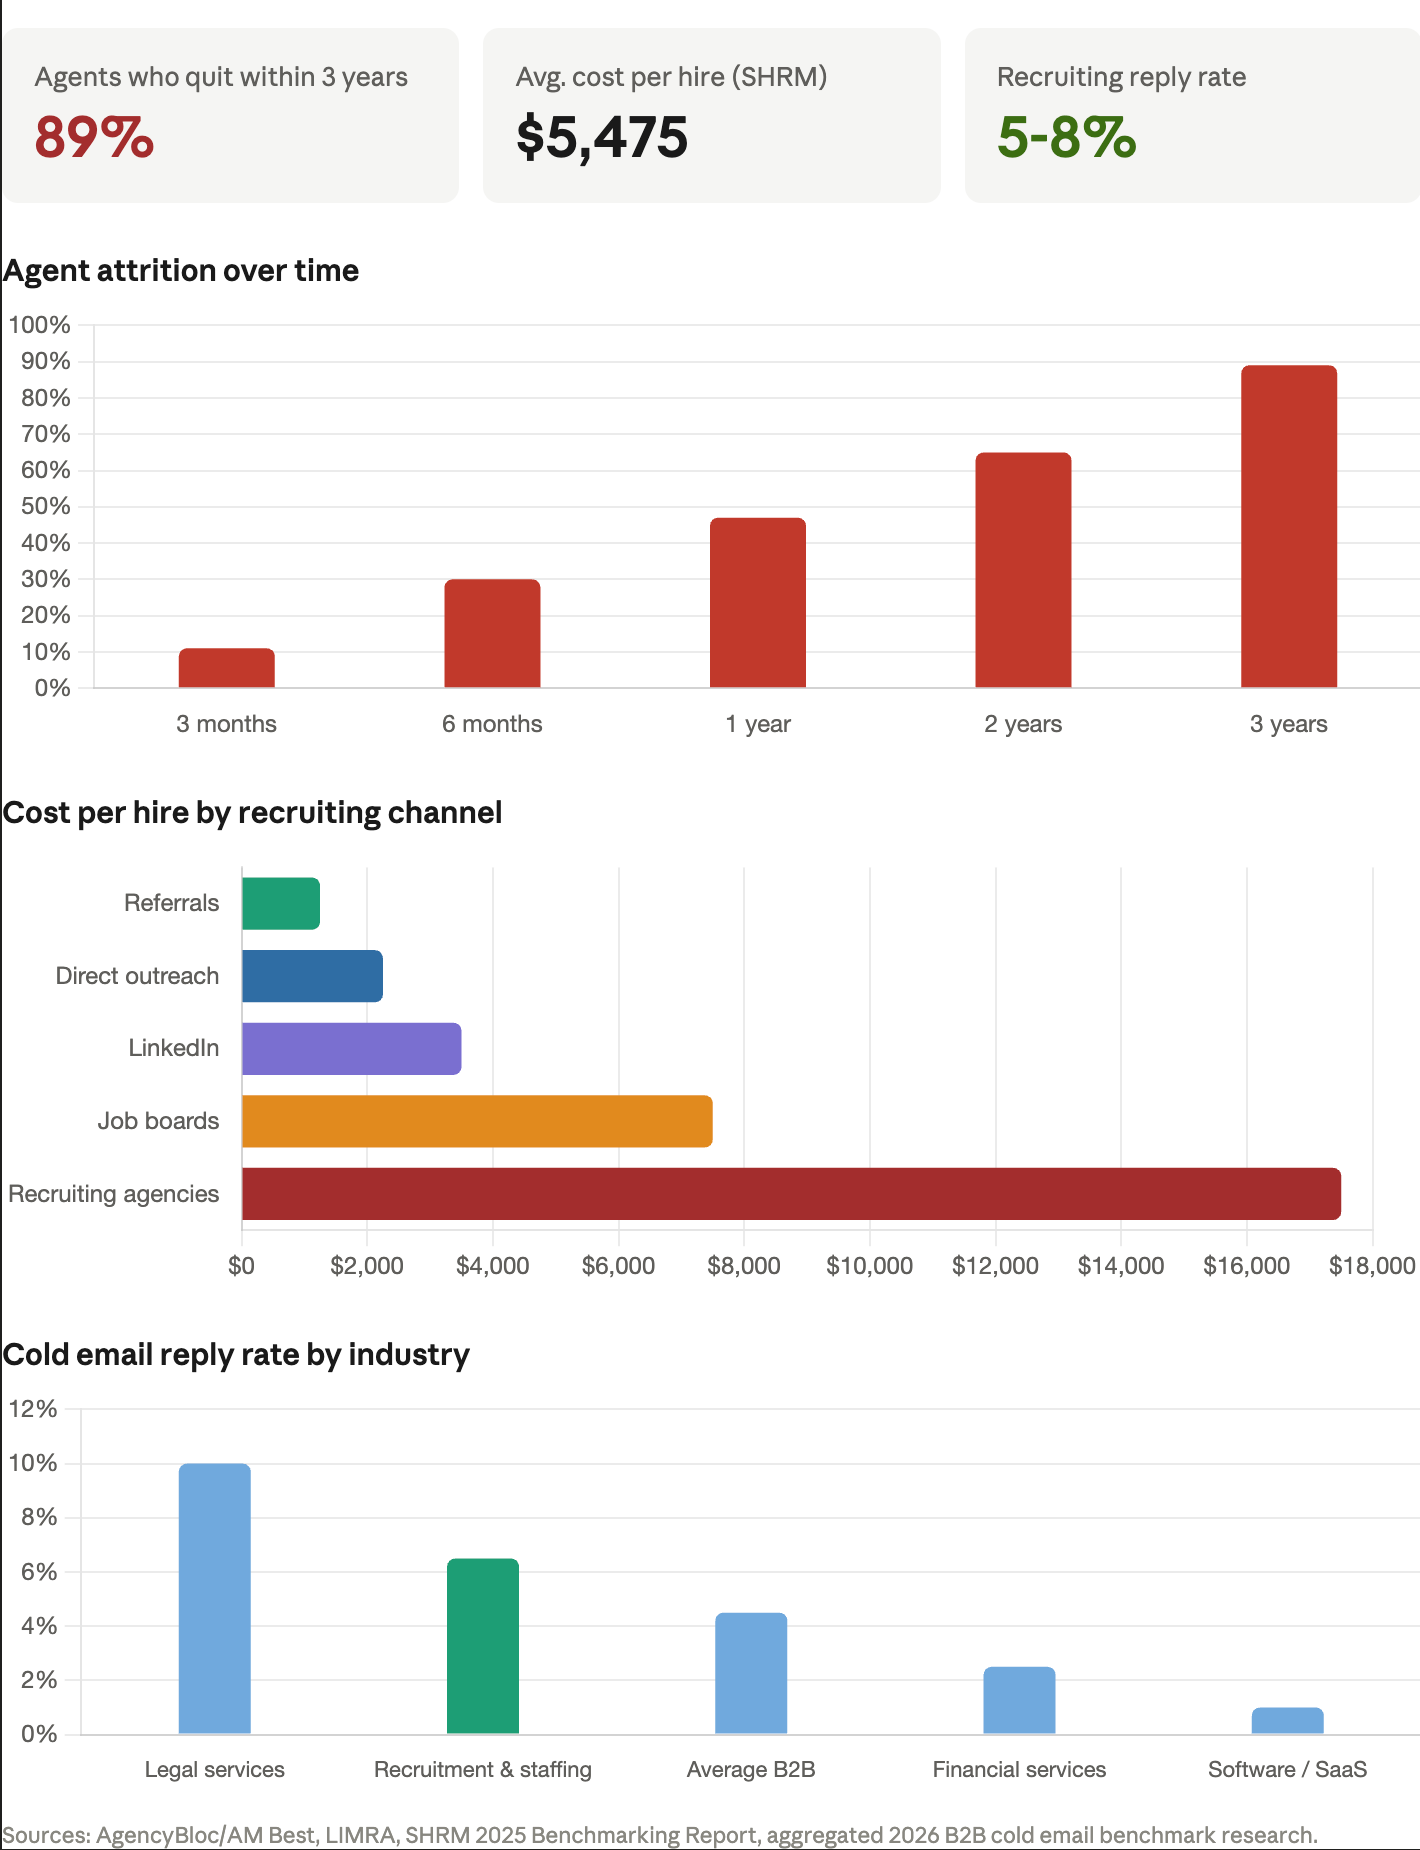
| Agents who quit within 3 years | ~89% | AgencyBloc, cited by AM Best |
| Financial professionals retained after 4 years | 15% | LIMRA (2020 data) |
| New agents who quit in first 90 days | ~30% | Industry research |
| Some agencies' annual 1099 agent turnover | Up to 90% | Industry reporting |
| Insurance agency staff turnover, 2025 vs. 2024 | Down 16% | Industry retention research |
What this means: for every 100 agents an agency recruits, fewer than 11 are still there three years later, based on the 89% figure. That single statistic is the strongest argument for treating recruiting as a continuous, year-round function rather than a one-time event. If turnover is this high industry-wide, agencies that recruit consistently will always outperform agencies that recruit reactively.
It's also worth breaking down when most of that attrition actually happens, since it changes how agencies should think about onboarding. Research tracking former agents found that roughly 11% quit within the first three months, another 19% leave between three and six months, 17% more leave within seven to twelve months, and about 18% leave within their first one to two years. That means roughly two-thirds of all eventual attrition happens within the first two years, with the heaviest concentration in the first six months.
That front-loaded pattern points to onboarding and early production support as the highest-leverage place to intervene. An agency that can keep a new agent productive and engaged through their first 90 to 180 days addresses the period where the largest share of attrition actually occurs.
Insurance Industry Workforce Statistics
The broader labor market context matters too. Several converging trends are making licensed agents harder to find and more valuable to recruit directly.
- Projected growth: employment of insurance sales agents is projected to grow approximately 8% from 2022 to 2032, according to data tracked by the Insurance Information Institute, rising from roughly 536,800 to 579,300 positions.
- Workforce attrition risk: the U.S. Bureau of Labor Statistics has projected that the broader insurance sector could lose hundreds of thousands of workers to attrition in the coming years, driven significantly by an aging workforce approaching retirement.
- Demographics: a majority of current insurance agents, around two-thirds, are over the age of 40, according to workforce data aggregators, reinforcing the urgency around recruiting newer talent into the field.
Taken together, this paints a picture of an industry where demand for licensed agents is growing while the existing workforce is aging out, a combination that increases the value of any agency with a reliable, repeatable way to recruit.
Recruiting Cost Statistics
General hiring data from SHRM, the gold standard for workforce cost benchmarking, gives a useful baseline for what recruiting actually costs once every expense is accounted for.
| Metric | Figure | Source |
|---|---|---|
| Average cost per hire (non-executive, all industries) | $4,700 - $5,475 | SHRM 2025 Benchmarking Report |
| Average time-to-fill | 42 - 44 days | SHRM |
| Recruiting agency fees (contingency) | 15% - 25% of first-year salary | SHRM / industry benchmarks |
| Cost of a bad hire | 30% - 50% of first-year salary | U.S. Department of Labor / SHRM |
These figures are general workforce benchmarks, not insurance-specific, but they illustrate why the hidden costs of recruiting (vacancy time, agency fees, bad-hire risk) typically dwarf the visible costs like a job board posting fee. Based on what we see across insurance agency clients specifically, direct outreach to already-licensed agents tends to land meaningfully below these general benchmarks, since it skips the licensing delay and much of the screening overhead that drives costs up in industries with a hiring funnel built around unlicensed applicants.
Cold Email Recruiting Benchmarks
Cold email is one of the most measurable recruiting channels available, and the data on it has matured significantly. A few benchmarks stand out as particularly relevant to insurance agent recruiting specifically.
| Metric | Benchmark | Source |
|---|---|---|
| Average cold email open rate (2026) | 27.7% - 44% | Aggregated 2026 benchmark data |
| Average B2B reply rate (all industries) | 3.1% - 5.8% | Aggregated 2026 benchmark data |
| Recruitment & staffing reply rate specifically | 5% - 8% | Industry vertical benchmark data |
| Top 10% of campaigns, reply rate | 10%+ | Aggregated 2026 benchmark data |
| Reply rate lift from personalized subject lines | +133% (3% to 7%) | 5.5M email dataset |
| Reply rate, small targeted lists (under 50) vs. large (1,000+) | 5.8% vs. 2.1% | Aggregated 2026 benchmark data |
| Decision-makers preferring cold email over LinkedIn/calls | 61% | B2B buyer preference research |
The standout figure here is that recruitment and staffing campaigns consistently post higher reply rates, 5% to 8%, than the broader B2B average of 3.1% to 5.8%. That's a meaningful structural advantage: licensed insurance agents responding to a relevant recruiting message tend to engage at a noticeably higher rate than the average cold sales email, likely because the message is about their career and income, not a product pitch.
The data on list size and targeting also reinforces something we see consistently in practice: a smaller, tightly filtered list of licensed agents who match a specific profile (state, license type, years licensed) outperforms a broad, unfiltered list almost every time.
Email length also matters more than most agencies assume. Top-performing cold outreach campaigns across industries keep initial messages under 80 to 125 words, far shorter than the multi-paragraph pitches many agencies still send. The agents most likely to respond are the ones already busy producing, and a long email asking them to read a full sales pitch about a new opportunity competes poorly against a short, direct message that respects their time and gets to the point.
Deliverability is the other factor that's easy to overlook. Roughly 17% of cold emails never reach the inbox at all, typically due to poor domain authentication, high bounce rates, or spam-triggering language, regardless of how well the message itself is written. That makes domain setup, list verification, and sending infrastructure just as important to recruiting results as the message content.
Insurance Licensing Statistics
Licensing data adds useful context for why recruiting already-licensed agents is fundamentally different from recruiting unlicensed candidates.
- First-time exam pass rate: of the roughly 382,900 people who took a licensing exam for the first time in a recent tracked year, only about 57.9% passed, according to National Association of Insurance Commissioners data.
- Pass rate variance: pass rates vary enormously by state and license type, from a high of roughly 81.5% for Personal Lines exams in some states to a low near 28.7% for certain Casualty Insurance Broker exams elsewhere.
In practical terms, this means a meaningful share of unlicensed candidates an agency tries to recruit and train will never pass their exam at all, on top of the attrition that happens after licensing. Every unlicensed hire carries that additional failure risk before they've sold a single policy.
What This Data Means for Agencies
Put together, a few clear conclusions emerge from this data:
- Recruiting can't be a one-time event. With turnover near 89% over three years, agencies need a continuous recruiting pipeline, not a campaign they run once and forget.
- Licensed agents are the safer bet. Licensing exam pass rates well under 60% mean unlicensed recruits carry real failure risk before they ever produce. Recruiting agents who are already licensed removes that risk entirely.
- Cold email has a real structural advantage in this industry. Recruitment-specific reply rates of 5-8%, well above the general B2B average, suggest licensed agents respond well to direct, relevant outreach about new opportunities.
- Hidden costs dominate the real number. The visible cost of a job board posting is the smallest part of total recruiting cost once vacancy time, screening, and attrition are factored in.
- The workforce is aging, and demand is growing. Projected growth in agent employment combined with an aging existing workforce means competition for licensed agents will likely intensify, not ease, in the coming years.
For a deeper breakdown of recruiting strategy built around these realities, see our guide: How to Recruit Insurance Agents: What Actually Works (And What Doesn't), or our look at Insurance Agent Recruiting Cost: Job Boards vs. Direct Outreach.
Need Help Applying This Data to Your Agency?
At Agency Builder Pro, we build recruiting campaigns around exactly the dynamics this data points to: continuous outreach, licensed agents only, and targeted, relevant messaging that performs above the general cold email average.
Book a call to discuss your agency's recruiting strategy
Statistics on this page are compiled from publicly available sources including SHRM, LIMRA, the National Association of Insurance Commissioners, the U.S. Bureau of Labor Statistics, and aggregated 2026 industry benchmark research. Figures are presented as reported by these sources and should be treated as directional industry benchmarks rather than guarantees of individual results. This page will be updated periodically as new data becomes available.